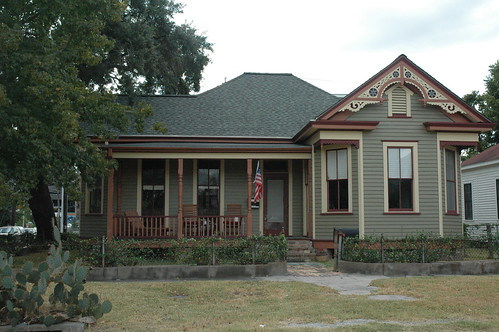
Take a photo tour of Old 6th Ward Historic District at http://goo.gl/aSDj. I drove almost every street and took a picture of each house along the way. If you taped them all together you could have your own panoramic...
There are currently 14 homes for sale on the market in Old 6th Ward Historic District (OSW) and 4 have closed so far this year as of 10/31/2010. That means there is almost a 3 year supply of homes on the market. There are approximately 356 homes in this district. The chart below shows the number of homes that have sold each year since 1997 through 2009. The green line is the trendline, upwards, barely. On average, 3.5% of the homes have successfully changed hands each year. This chart does not take into account the number of attempted sales that were never completed.

When you look at homes sales going back to 1997, the year before OSW became a historic district, the average sales price per square foot rose from $64.24 in 1997 to $154.35 in 2009 spanning 132 home sales, a whopping 140% increase. This seems rather extraordinary. It's important to dig deeper and think about why this might occur since the data points are so few (there are so few homes sales each year).

OSW had been a historic district since 1998. That could be one reason. Another reason might not be as obvious. When you look closer at each of the 132 sales that have occurred in this time frame and break them down, 48% were 1x sales, meaning I can't look at them and see what they sold for a second time around because they have only sold 1x in this 12 year time period (2009 being the last full year of data).
When I look at the other 51% of the homes that sold in detail, I start to see things like:
Home 1 Sales
06/22/2007 : sales price $122,500
04/30/2009 : sales price $284,100
Home 2 Sales
09/28/2001 : sales price $190,000
05/11/2005 : sales price $375,000
Home 3 Sales
12/28/2001 : sales price $150,000
08/29/2003 : sales price $167,000
07/31/2007 : sales price $222,000
Home 4 Sales
07/09/1999 : sales price $139,000
01/05/2001 : sales price $242,000
03/26/2004 : sales price $260,000
Home 5 Sales
08/27/1999 : sales price $68,500
11/20/2006 : sales price $290,000
In the sales above, I can see a few things. I can look in the MLS and see that someone put some $$ into these homes at some point. I can also see that in the timeframe where the property sold and a renovation had not occurred, the sales price increase is not as dramatic. For example, Home 4: in the first 18 month timeframe, the home went from $139,000 to $242,000. How much did the homeowner spend renovating? I don't know. I do know that the next time around, a period in excess of 3 years, the second sale only increased $18,000.
The examples above are where there were multiple sales of the same house and it looks like things went well based on a large increase in sales price. That wasn't the case for all home sales that occurred multiple times over this 12 year period. See the sales below.
Home 1 Sales
11/13/2000 : sales price $126,000
12/27/2006 : sales price $141,000
Home 2 Sales
06/08/1999 : sales price $239,000
11/04/2004 : sales price $260,000
Home 3 Sales
10/26/2000 : sales price $130,000
10/14/2005 : sales price $140,000
Home 4 Sales
03/04/2002 : $152,600
12/02/2004 : $162,000
Home 5 Sales
02/15/2006 : sales price $210,000
06/20/2008 : sales price $216,101
These sales tell a different story from the first group.
Another way to gain more information and insight is to look at lot sales in the neighborhood. What kind of activity have they had over the same time period and how much have they appreciated?
There have been 16 lot sales in OSW historic district in the past 12 years that I can see in the Multiple Listing Service (MLS).
Of the 16 lot sales, only 3 lots sold more than 1x during this 12 year period.
Lot 1 sale
05/07/1997 : sales price $ 33,000
08/25/2000 : sales price $108,750
Someone built a beautiful modern home on it after that and it is not in keeping with the style of the neighbhorhood. For whatever reason, this recently built home has now been on the market 228 days and is currently listed at $155/sq. ft, much lower than a similar home would be here in the Heights. I wonder how much it cost to build the house?
Lot 2 sale
05/04/2004 : sales price $144,000
04/03/2007 : sales price $237,000
For some reason the seller put it back on the market approximately 4 months after the last sale in 2007, just slightly above what they paid for it. They tried to sell it for 576 days decreasing the sales price as time progressed, eventually ending at an asking price that was only 81% of what they had originally paid. After taking a break for about a year, it was for sale again and to date has not sold (through the MLS) and the listing expired at 66% of their original sales price. Please note, 2008 and 2009 were some tough years for real estate regardless of what neighborhood a property was located, even in inner-loop Houston. In addition, currently obtaining financing for a vacant lot requires an act of God.
Lot 3 sale
02/21/2005 : sales price $132,000
04/03/2007 : sales price $194,000
This sale followed the same scenario as above and appears to be owned by the same owner.
Of the other 10 lot sales, 6 do not specify the lot square footage in the MLS and that leaves only 4. I can tell you the trend was up from 1998 to 2009, but with so few data points, I would want to know more about the particulars of each sale because these 10 sales leave me with less than 1 lot sold per year on average. What can I gather from that?
Only one chance to opt out of the Historic District, many chances to opt in! http://goo.gl/lzT67
.............................................................................................
visit my entire blog at http://blogs.har.com/cynthiamullins
Client Experience Rating: http://goo.gl/bCoMo
email cynthia@cynthiamullins.com
follow me at www.twitter.com/cynthiamullins
friend me at www.facebook.com/cynthiamullins1
see what people like about the Heights and what they think is its best kept secret at www.youtube.com/cynthiamullins
houston heights real estate housing market homes for sale buying selling inner loop properties houston texas tx OPEN Houses 1545 Heights Boulevard, Houston, TX 77008 77007 77009 houston heights realtor Woodland Heights Norhill Sunset Heights